| 0 | 1 | 2 | 3 | 4 | 5 | 6 | 7 | 8 | |
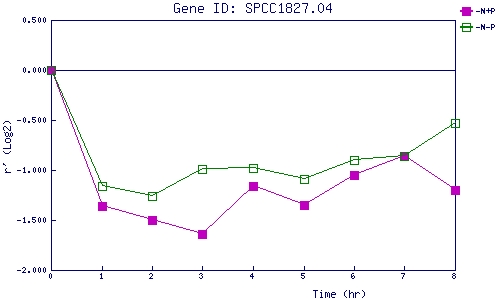
| -N+P | 0.000 | -1.356 | -1.499 | -1.643 | -1.156 | -1.351 | -1.051 | -0.855 | -1.198 |
| -N-P | 0.000 | -1.162 | -1.259 | -0.990 | -0.977 | -1.088 | -0.903 | -0.861 | -0.532 |
|
-N+P: Nitrogen starved in the presence of P-factor -N-P: Nitrogen starved in the absence of P-factor |