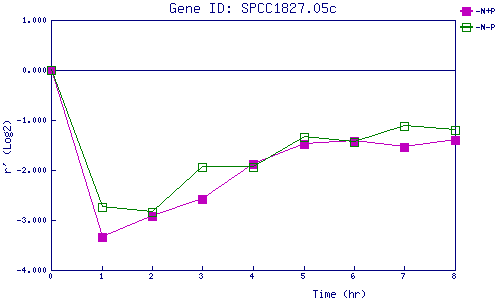
| 0 | 1 | 2 | 3 | 4 | 5 | 6 | 7 | 8 | |
| -N+P | 0.000 | -3.347 | -2.915 | -2.573 | -1.879 | -1.484 | -1.414 | -1.540 | -1.408 |
| -N-P | 0.000 | -2.743 | -2.844 | -1.948 | -1.937 | -1.346 | -1.442 | -1.115 | -1.199 |
|
-N+P: Nitrogen starved in the presence of P-factor -N-P: Nitrogen starved in the absence of P-factor |