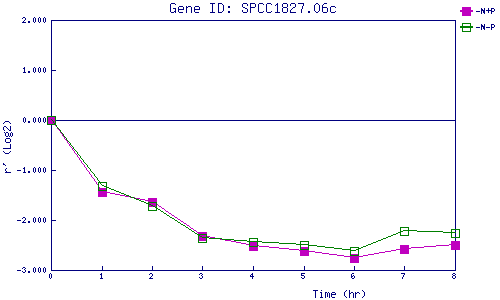
| 0 | 1 | 2 | 3 | 4 | 5 | 6 | 7 | 8 | |
| -N+P | 0.000 | -1.432 | -1.638 | -2.314 | -2.512 | -2.623 | -2.752 | -2.575 | -2.493 |
| -N-P | 0.000 | -1.325 | -1.720 | -2.362 | -2.449 | -2.497 | -2.622 | -2.222 | -2.261 |
|
-N+P: Nitrogen starved in the presence of P-factor -N-P: Nitrogen starved in the absence of P-factor |