sal3 pse1
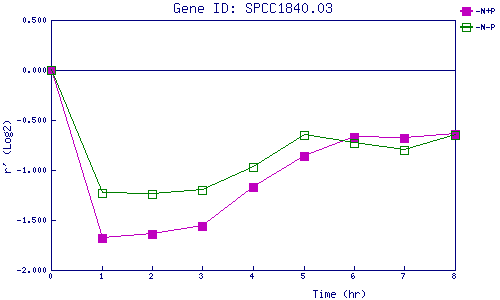
| 0 | 1 | 2 | 3 | 4 | 5 | 6 | 7 | 8 | |
| -N+P | 0.000 | -1.676 | -1.645 | -1.555 | -1.173 | -0.859 | -0.671 | -0.676 | -0.638 |
| -N-P | 0.000 | -1.229 | -1.237 | -1.202 | -0.969 | -0.649 | -0.732 | -0.797 | -0.649 |
|
-N+P: Nitrogen starved in the presence of P-factor -N-P: Nitrogen starved in the absence of P-factor |