| 0 | 1 | 2 | 3 | 4 | 5 | 6 | 7 | 8 | |
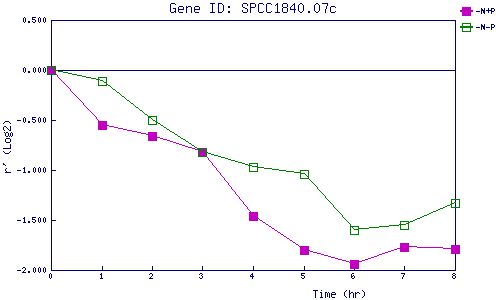
| -N+P | 0.000 | -0.546 | -0.660 | -0.818 | -1.462 | -1.796 | -1.939 | -1.772 | -1.788 |
| -N-P | 0.000 | -0.114 | -0.497 | -0.818 | -0.971 | -1.041 | -1.597 | -1.547 | -1.326 |
|
-N+P: Nitrogen starved in the presence of P-factor -N-P: Nitrogen starved in the absence of P-factor |