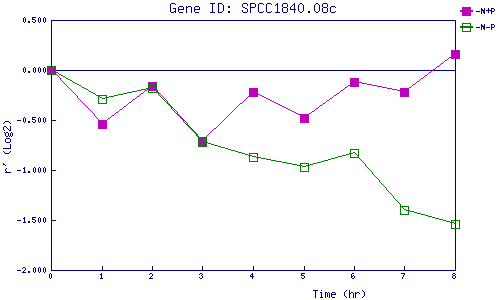
| 0 | 1 | 2 | 3 | 4 | 5 | 6 | 7 | 8 | |
| -N+P | 0.000 | -0.544 | -0.165 | -0.707 | -0.218 | -0.482 | -0.115 | -0.220 | 0.156 |
| -N-P | 0.000 | -0.292 | -0.182 | -0.724 | -0.872 | -0.968 | -0.831 | -1.404 | -1.535 |
|
-N+P: Nitrogen starved in the presence of P-factor -N-P: Nitrogen starved in the absence of P-factor |