lsm8
| 0 | 1 | 2 | 3 | 4 | 5 | 6 | 7 | 8 | |
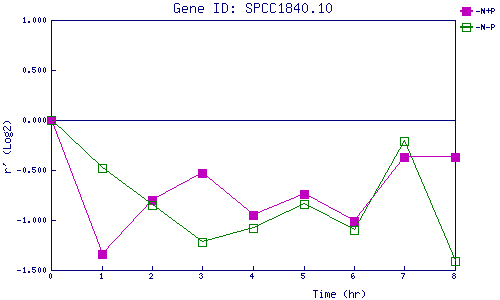
| -N+P | 0.000 | -1.342 | -0.801 | -0.526 | -0.947 | -0.738 | -1.007 | -0.374 | -0.369 |
| -N-P | 0.000 | -0.476 | -0.847 | -1.217 | -1.080 | -0.842 | -1.100 | -0.208 | -1.413 |
|
-N+P: Nitrogen starved in the presence of P-factor -N-P: Nitrogen starved in the absence of P-factor |
