par1
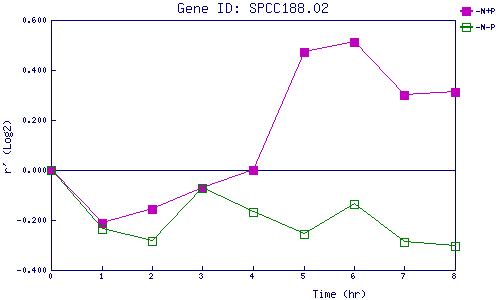
| 0 | 1 | 2 | 3 | 4 | 5 | 6 | 7 | 8 | |
| -N+P | 0.000 | -0.212 | -0.157 | -0.072 | -0.001 | 0.471 | 0.511 | 0.300 | 0.313 |
| -N-P | 0.000 | -0.235 | -0.285 | -0.073 | -0.167 | -0.255 | -0.136 | -0.290 | -0.304 |
|
-N+P: Nitrogen starved in the presence of P-factor -N-P: Nitrogen starved in the absence of P-factor |