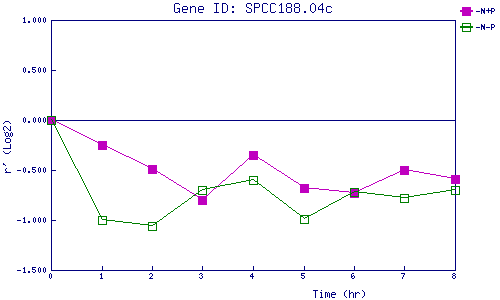
| 0 | 1 | 2 | 3 | 4 | 5 | 6 | 7 | 8 | |
| -N+P | 0.000 | -0.248 | -0.489 | -0.801 | -0.347 | -0.682 | -0.734 | -0.502 | -0.594 |
| -N-P | 0.000 | -0.999 | -1.058 | -0.696 | -0.601 | -0.986 | -0.721 | -0.776 | -0.695 |
|
-N+P: Nitrogen starved in the presence of P-factor -N-P: Nitrogen starved in the absence of P-factor |