srp54
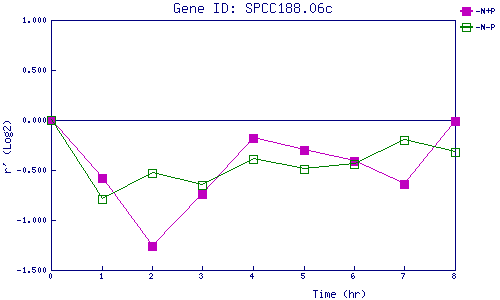
| 0 | 1 | 2 | 3 | 4 | 5 | 6 | 7 | 8 | |
| -N+P | 0.000 | -0.576 | -1.260 | -0.742 | -0.184 | -0.301 | -0.413 | -0.643 | -0.009 |
| -N-P | 0.000 | -0.789 | -0.533 | -0.653 | -0.390 | -0.490 | -0.441 | -0.199 | -0.315 |
|
-N+P: Nitrogen starved in the presence of P-factor -N-P: Nitrogen starved in the absence of P-factor |