meu3
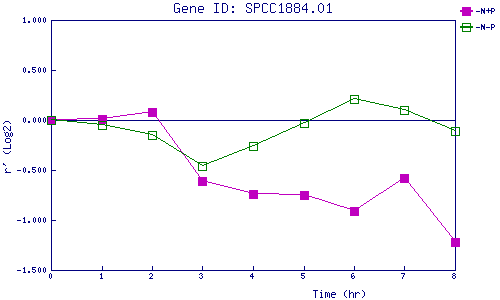
| 0 | 1 | 2 | 3 | 4 | 5 | 6 | 7 | 8 | |
| -N+P | 0.000 | 0.009 | 0.075 | -0.612 | -0.742 | -0.754 | -0.908 | -0.581 | -1.219 |
| -N-P | 0.000 | -0.052 | -0.150 | -0.457 | -0.255 | -0.031 | 0.209 | 0.098 | -0.106 |
|
-N+P: Nitrogen starved in the presence of P-factor -N-P: Nitrogen starved in the absence of P-factor |