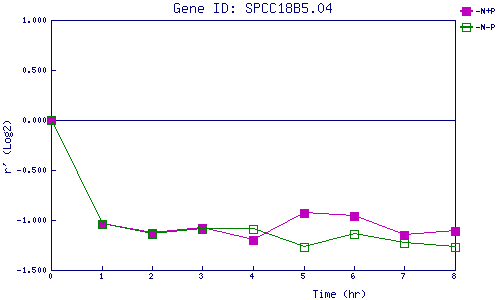
| 0 | 1 | 2 | 3 | 4 | 5 | 6 | 7 | 8 | |
| -N+P | 0.000 | -1.040 | -1.127 | -1.079 | -1.199 | -0.929 | -0.960 | -1.149 | -1.112 |
| -N-P | 0.000 | -1.042 | -1.145 | -1.087 | -1.089 | -1.266 | -1.139 | -1.227 | -1.273 |
|
-N+P: Nitrogen starved in the presence of P-factor -N-P: Nitrogen starved in the absence of P-factor |
