erf1 sup45
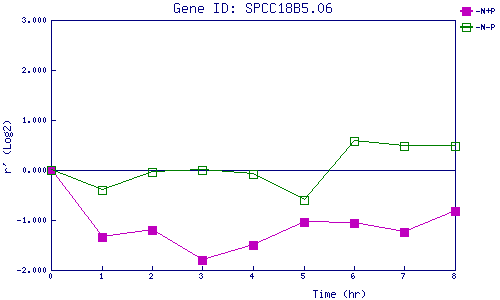
| 0 | 1 | 2 | 3 | 4 | 5 | 6 | 7 | 8 | |
| -N+P | 0.000 | -1.331 | -1.208 | -1.809 | -1.508 | -1.032 | -1.056 | -1.244 | -0.815 |
| -N-P | 0.000 | -0.407 | -0.031 | -0.003 | -0.082 | -0.608 | 0.576 | 0.481 | 0.475 |
|
-N+P: Nitrogen starved in the presence of P-factor -N-P: Nitrogen starved in the absence of P-factor |