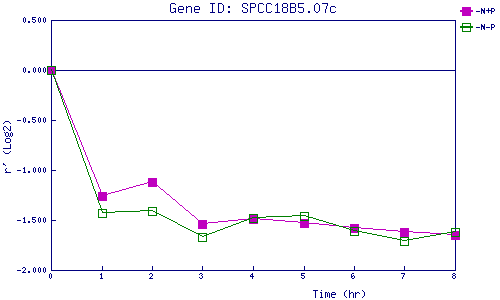
| 0 | 1 | 2 | 3 | 4 | 5 | 6 | 7 | 8 | |
| -N+P | 0.000 | -1.256 | -1.125 | -1.543 | -1.490 | -1.528 | -1.585 | -1.617 | -1.647 |
| -N-P | 0.000 | -1.432 | -1.406 | -1.674 | -1.475 | -1.457 | -1.614 | -1.707 | -1.625 |
|
-N+P: Nitrogen starved in the presence of P-factor -N-P: Nitrogen starved in the absence of P-factor |