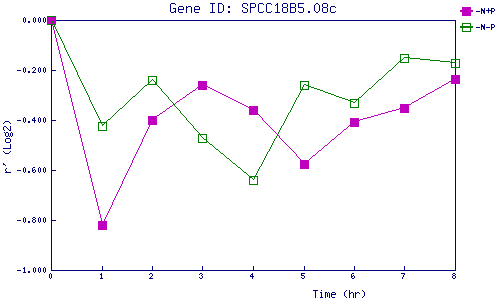
| 0 | 1 | 2 | 3 | 4 | 5 | 6 | 7 | 8 | |
| -N+P | 0.000 | -0.820 | -0.401 | -0.261 | -0.361 | -0.578 | -0.410 | -0.352 | -0.235 |
| -N-P | 0.000 | -0.422 | -0.239 | -0.474 | -0.640 | -0.260 | -0.331 | -0.151 | -0.172 |
|
-N+P: Nitrogen starved in the presence of P-factor -N-P: Nitrogen starved in the absence of P-factor |