| 0 | 1 | 2 | 3 | 4 | 5 | 6 | 7 | 8 | |
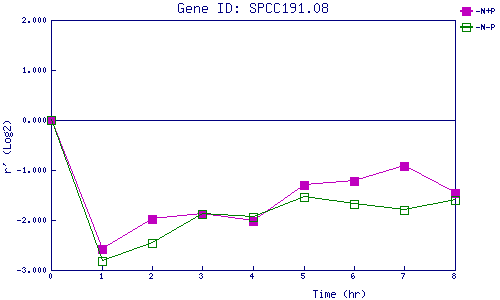
| -N+P | 0.000 | -2.582 | -1.972 | -1.886 | -2.020 | -1.294 | -1.217 | -0.930 | -1.460 |
| -N-P | 0.000 | -2.826 | -2.459 | -1.871 | -1.937 | -1.549 | -1.670 | -1.799 | -1.591 |
|
-N+P: Nitrogen starved in the presence of P-factor -N-P: Nitrogen starved in the absence of P-factor |