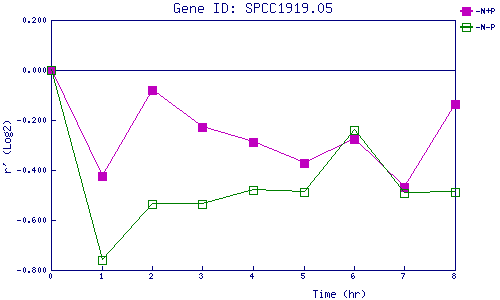
| 0 | 1 | 2 | 3 | 4 | 5 | 6 | 7 | 8 | |
| -N+P | 0.000 | -0.422 | -0.078 | -0.227 | -0.289 | -0.373 | -0.276 | -0.469 | -0.134 |
| -N-P | 0.000 | -0.760 | -0.535 | -0.534 | -0.482 | -0.489 | -0.240 | -0.491 | -0.488 |
|
-N+P: Nitrogen starved in the presence of P-factor -N-P: Nitrogen starved in the absence of P-factor |