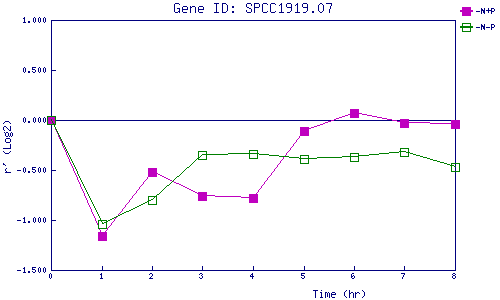
| 0 | 1 | 2 | 3 | 4 | 5 | 6 | 7 | 8 | |
| -N+P | 0.000 | -1.159 | -0.525 | -0.763 | -0.775 | -0.111 | 0.070 | -0.029 | -0.044 |
| -N-P | 0.000 | -1.037 | -0.801 | -0.347 | -0.339 | -0.388 | -0.367 | -0.316 | -0.472 |
|
-N+P: Nitrogen starved in the presence of P-factor -N-P: Nitrogen starved in the absence of P-factor |