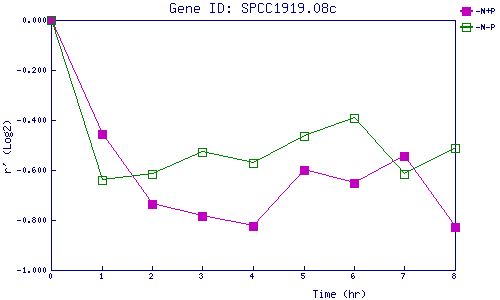
| 0 | 1 | 2 | 3 | 4 | 5 | 6 | 7 | 8 | |
| -N+P | 0.000 | -0.456 | -0.736 | -0.786 | -0.823 | -0.601 | -0.651 | -0.544 | -0.829 |
| -N-P | 0.000 | -0.639 | -0.615 | -0.528 | -0.572 | -0.462 | -0.393 | -0.614 | -0.510 |
|
-N+P: Nitrogen starved in the presence of P-factor -N-P: Nitrogen starved in the absence of P-factor |