tif6
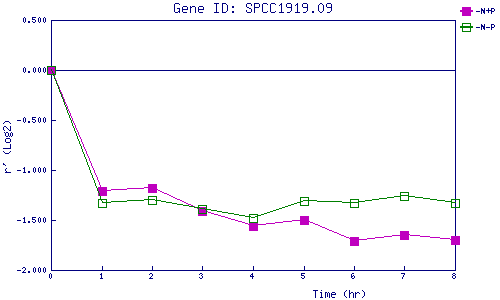
| 0 | 1 | 2 | 3 | 4 | 5 | 6 | 7 | 8 | |
| -N+P | 0.000 | -1.207 | -1.176 | -1.409 | -1.565 | -1.503 | -1.714 | -1.651 | -1.697 |
| -N-P | 0.000 | -1.334 | -1.303 | -1.392 | -1.480 | -1.313 | -1.328 | -1.259 | -1.334 |
|
-N+P: Nitrogen starved in the presence of P-factor -N-P: Nitrogen starved in the absence of P-factor |