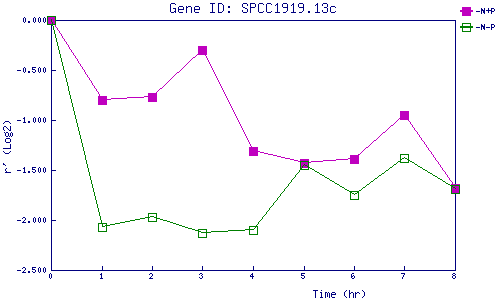
| 0 | 1 | 2 | 3 | 4 | 5 | 6 | 7 | 8 | |
| -N+P | 0.000 | -0.799 | -0.773 | -0.295 | -1.313 | -1.432 | -1.391 | -0.953 | -1.679 |
| -N-P | 0.000 | -2.066 | -1.967 | -2.126 | -2.099 | -1.447 | -1.754 | -1.385 | -1.688 |
|
-N+P: Nitrogen starved in the presence of P-factor -N-P: Nitrogen starved in the absence of P-factor |