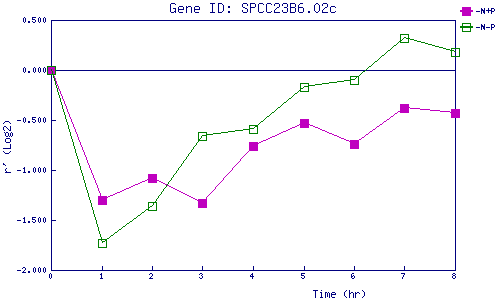
| 0 | 1 | 2 | 3 | 4 | 5 | 6 | 7 | 8 | |
| -N+P | 0.000 | -1.295 | -1.075 | -1.333 | -0.755 | -0.527 | -0.735 | -0.379 | -0.432 |
| -N-P | 0.000 | -1.734 | -1.361 | -0.660 | -0.589 | -0.166 | -0.100 | 0.316 | 0.177 |
|
-N+P: Nitrogen starved in the presence of P-factor -N-P: Nitrogen starved in the absence of P-factor |