tel1
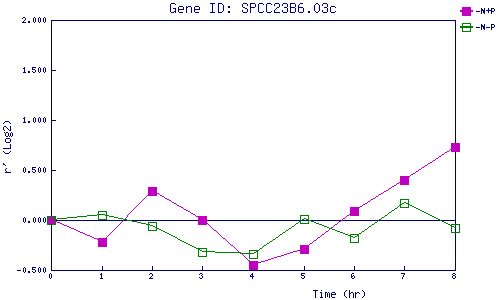
| 0 | 1 | 2 | 3 | 4 | 5 | 6 | 7 | 8 | |
| -N+P | 0.000 | -0.220 | 0.286 | -0.001 | -0.446 | -0.292 | 0.088 | 0.395 | 0.732 |
| -N-P | 0.000 | 0.049 | -0.059 | -0.316 | -0.341 | 0.013 | -0.180 | 0.166 | -0.076 |
|
-N+P: Nitrogen starved in the presence of P-factor -N-P: Nitrogen starved in the absence of P-factor |