ssb3 rpa3
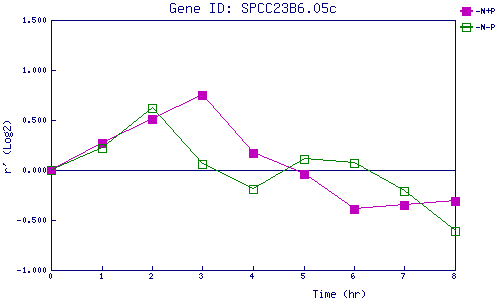
| 0 | 1 | 2 | 3 | 4 | 5 | 6 | 7 | 8 | |
| -N+P | 0.000 | 0.272 | 0.509 | 0.754 | 0.166 | -0.040 | -0.386 | -0.350 | -0.313 |
| -N-P | 0.000 | 0.216 | 0.620 | 0.064 | -0.193 | 0.106 | 0.068 | -0.209 | -0.606 |
|
-N+P: Nitrogen starved in the presence of P-factor -N-P: Nitrogen starved in the absence of P-factor |