cdc21
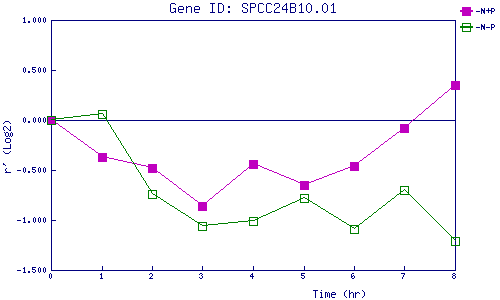
| 0 | 1 | 2 | 3 | 4 | 5 | 6 | 7 | 8 | |
| -N+P | 0.000 | -0.371 | -0.479 | -0.861 | -0.437 | -0.648 | -0.462 | -0.084 | 0.353 |
| -N-P | 0.000 | 0.065 | -0.736 | -1.065 | -1.009 | -0.780 | -1.089 | -0.695 | -1.211 |
|
-N+P: Nitrogen starved in the presence of P-factor -N-P: Nitrogen starved in the absence of P-factor |