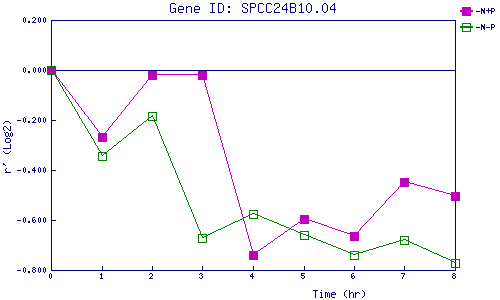
| 0 | 1 | 2 | 3 | 4 | 5 | 6 | 7 | 8 | |
| -N+P | 0.000 | -0.268 | -0.020 | -0.021 | -0.740 | -0.597 | -0.665 | -0.446 | -0.504 |
| -N-P | 0.000 | -0.343 | -0.184 | -0.670 | -0.574 | -0.660 | -0.740 | -0.680 | -0.772 |
|
-N+P: Nitrogen starved in the presence of P-factor -N-P: Nitrogen starved in the absence of P-factor |