| 0 | 1 | 2 | 3 | 4 | 5 | 6 | 7 | 8 | |
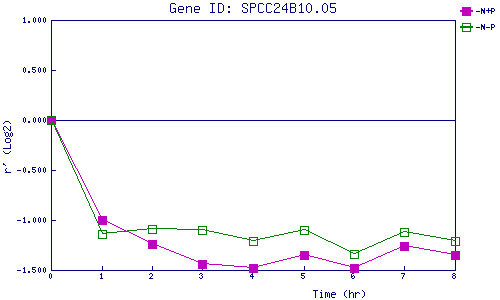
| -N+P | 0.000 | -1.002 | -1.236 | -1.440 | -1.482 | -1.353 | -1.476 | -1.264 | -1.353 |
| -N-P | 0.000 | -1.137 | -1.090 | -1.100 | -1.213 | -1.098 | -1.338 | -1.119 | -1.208 |
|
-N+P: Nitrogen starved in the presence of P-factor -N-P: Nitrogen starved in the absence of P-factor |