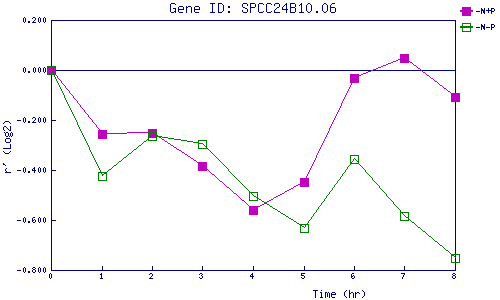
| 0 | 1 | 2 | 3 | 4 | 5 | 6 | 7 | 8 | |
| -N+P | 0.000 | -0.257 | -0.251 | -0.385 | -0.558 | -0.447 | -0.033 | 0.046 | -0.107 |
| -N-P | 0.000 | -0.424 | -0.264 | -0.298 | -0.504 | -0.633 | -0.357 | -0.583 | -0.753 |
|
-N+P: Nitrogen starved in the presence of P-factor -N-P: Nitrogen starved in the absence of P-factor |