| 0 | 1 | 2 | 3 | 4 | 5 | 6 | 7 | 8 | |
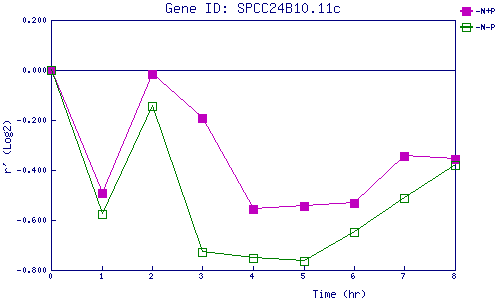
| -N+P | 0.000 | -0.491 | -0.014 | -0.194 | -0.556 | -0.543 | -0.532 | -0.345 | -0.357 |
| -N-P | 0.000 | -0.577 | -0.143 | -0.726 | -0.752 | -0.763 | -0.647 | -0.514 | -0.380 |
|
-N+P: Nitrogen starved in the presence of P-factor -N-P: Nitrogen starved in the absence of P-factor |