| 0 | 1 | 2 | 3 | 4 | 5 | 6 | 7 | 8 | |
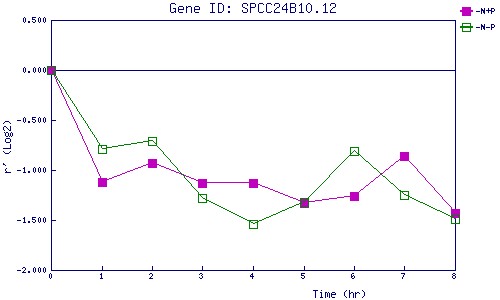
| -N+P | 0.000 | -1.120 | -0.926 | -1.129 | -1.127 | -1.333 | -1.260 | -0.860 | -1.431 |
| -N-P | 0.000 | -0.786 | -0.712 | -1.278 | -1.535 | -1.325 | -0.807 | -1.249 | -1.493 |
|
-N+P: Nitrogen starved in the presence of P-factor -N-P: Nitrogen starved in the absence of P-factor |