skb5
| 0 | 1 | 2 | 3 | 4 | 5 | 6 | 7 | 8 | |
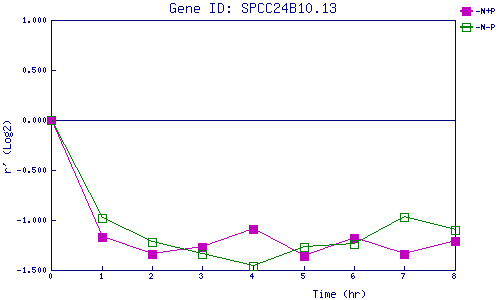
| -N+P | 0.000 | -1.170 | -1.338 | -1.269 | -1.093 | -1.362 | -1.184 | -1.336 | -1.206 |
| -N-P | 0.000 | -0.984 | -1.215 | -1.345 | -1.457 | -1.274 | -1.243 | -0.966 | -1.102 |
|
-N+P: Nitrogen starved in the presence of P-factor -N-P: Nitrogen starved in the absence of P-factor |