| 0 | 1 | 2 | 3 | 4 | 5 | 6 | 7 | 8 | |
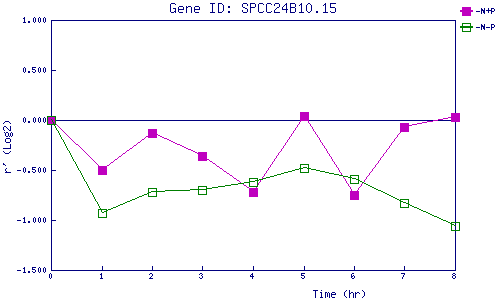
| -N+P | 0.000 | -0.496 | -0.134 | -0.364 | -0.716 | 0.040 | -0.749 | -0.071 | 0.034 |
| -N-P | 0.000 | -0.926 | -0.721 | -0.697 | -0.620 | -0.484 | -0.594 | -0.826 | -1.064 |
|
-N+P: Nitrogen starved in the presence of P-factor -N-P: Nitrogen starved in the absence of P-factor |