| 0 | 1 | 2 | 3 | 4 | 5 | 6 | 7 | 8 | |
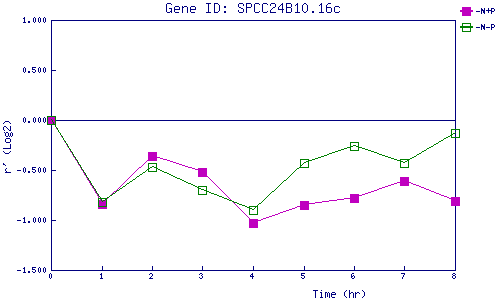
| -N+P | 0.000 | -0.837 | -0.365 | -0.525 | -1.027 | -0.847 | -0.784 | -0.614 | -0.808 |
| -N-P | 0.000 | -0.816 | -0.466 | -0.697 | -0.899 | -0.427 | -0.258 | -0.430 | -0.132 |
|
-N+P: Nitrogen starved in the presence of P-factor -N-P: Nitrogen starved in the absence of P-factor |