| 0 | 1 | 2 | 3 | 4 | 5 | 6 | 7 | 8 | |
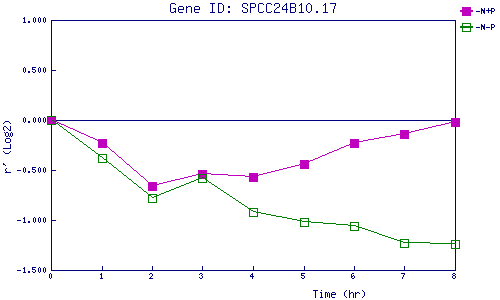
| -N+P | 0.000 | -0.230 | -0.659 | -0.540 | -0.566 | -0.437 | -0.228 | -0.135 | -0.021 |
| -N-P | 0.000 | -0.376 | -0.776 | -0.580 | -0.920 | -1.020 | -1.062 | -1.233 | -1.242 |
|
-N+P: Nitrogen starved in the presence of P-factor -N-P: Nitrogen starved in the absence of P-factor |