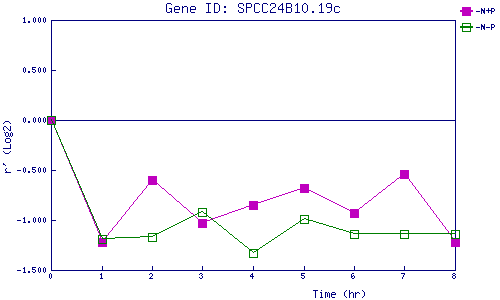
| 0 | 1 | 2 | 3 | 4 | 5 | 6 | 7 | 8 | |
| -N+P | 0.000 | -1.218 | -0.603 | -1.033 | -0.850 | -0.679 | -0.934 | -0.544 | -1.215 |
| -N-P | 0.000 | -1.192 | -1.173 | -0.918 | -1.334 | -0.991 | -1.139 | -1.142 | -1.139 |
|
-N+P: Nitrogen starved in the presence of P-factor -N-P: Nitrogen starved in the absence of P-factor |