tpi1 tpi
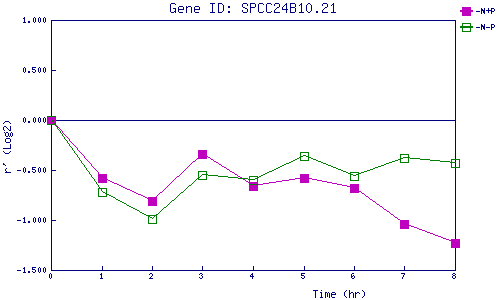
| 0 | 1 | 2 | 3 | 4 | 5 | 6 | 7 | 8 | |
| -N+P | 0.000 | -0.585 | -0.813 | -0.339 | -0.655 | -0.585 | -0.682 | -1.042 | -1.233 |
| -N-P | 0.000 | -0.715 | -0.987 | -0.550 | -0.598 | -0.364 | -0.562 | -0.379 | -0.434 |
|
-N+P: Nitrogen starved in the presence of P-factor -N-P: Nitrogen starved in the absence of P-factor |