| 0 | 1 | 2 | 3 | 4 | 5 | 6 | 7 | 8 | |
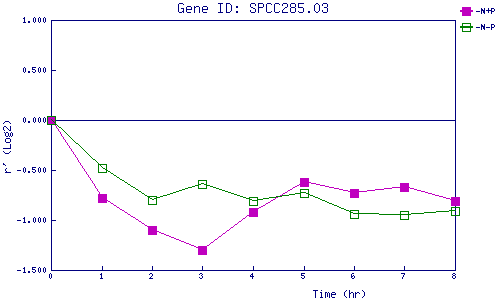
| -N+P | 0.000 | -0.779 | -1.104 | -1.296 | -0.916 | -0.619 | -0.729 | -0.672 | -0.812 |
| -N-P | 0.000 | -0.482 | -0.796 | -0.645 | -0.809 | -0.734 | -0.944 | -0.948 | -0.906 |
|
-N+P: Nitrogen starved in the presence of P-factor -N-P: Nitrogen starved in the absence of P-factor |