lsm7
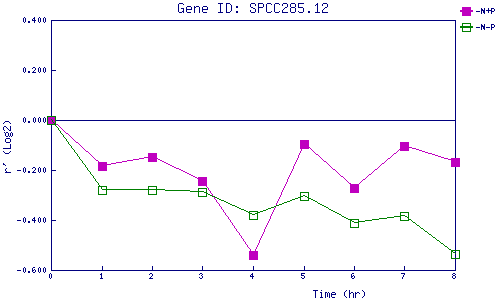
| 0 | 1 | 2 | 3 | 4 | 5 | 6 | 7 | 8 | |
| -N+P | 0.000 | -0.184 | -0.148 | -0.245 | -0.539 | -0.098 | -0.271 | -0.102 | -0.167 |
| -N-P | 0.000 | -0.281 | -0.280 | -0.286 | -0.380 | -0.302 | -0.411 | -0.385 | -0.536 |
|
-N+P: Nitrogen starved in the presence of P-factor -N-P: Nitrogen starved in the absence of P-factor |