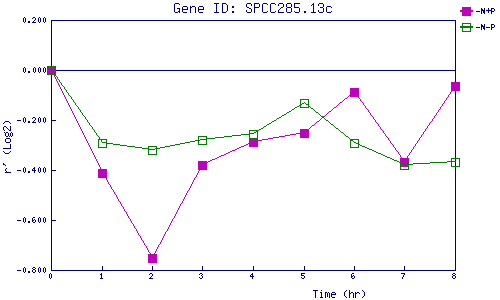
| 0 | 1 | 2 | 3 | 4 | 5 | 6 | 7 | 8 | |
| -N+P | 0.000 | -0.413 | -0.753 | -0.379 | -0.286 | -0.252 | -0.086 | -0.368 | -0.064 |
| -N-P | 0.000 | -0.293 | -0.319 | -0.278 | -0.254 | -0.131 | -0.291 | -0.380 | -0.370 |
|
-N+P: Nitrogen starved in the presence of P-factor -N-P: Nitrogen starved in the absence of P-factor |