spp27 uaf30
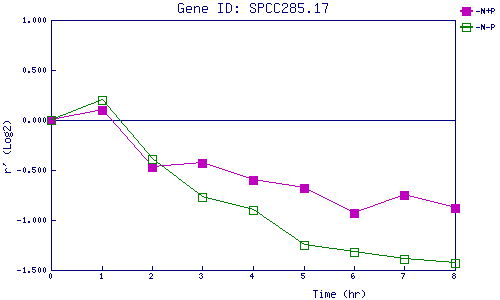
| 0 | 1 | 2 | 3 | 4 | 5 | 6 | 7 | 8 | |
| -N+P | 0.000 | 0.096 | -0.466 | -0.431 | -0.599 | -0.682 | -0.934 | -0.753 | -0.884 |
| -N-P | 0.000 | 0.201 | -0.388 | -0.766 | -0.904 | -1.249 | -1.316 | -1.394 | -1.426 |
|
-N+P: Nitrogen starved in the presence of P-factor -N-P: Nitrogen starved in the absence of P-factor |