rpc34
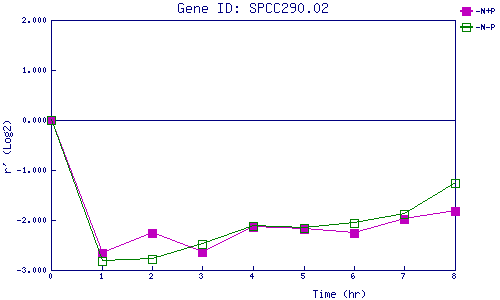
| 0 | 1 | 2 | 3 | 4 | 5 | 6 | 7 | 8 | |
| -N+P | 0.000 | -2.661 | -2.266 | -2.641 | -2.142 | -2.184 | -2.259 | -1.983 | -1.820 |
| -N-P | 0.000 | -2.820 | -2.786 | -2.481 | -2.118 | -2.163 | -2.059 | -1.874 | -1.260 |
|
-N+P: Nitrogen starved in the presence of P-factor -N-P: Nitrogen starved in the absence of P-factor |