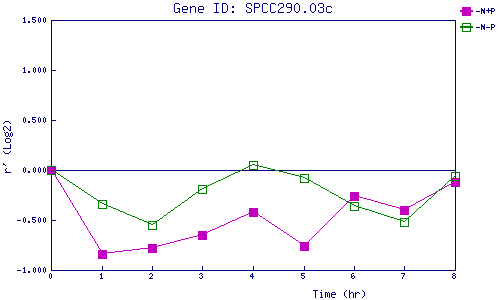
| 0 | 1 | 2 | 3 | 4 | 5 | 6 | 7 | 8 | |
| -N+P | 0.000 | -0.838 | -0.778 | -0.648 | -0.425 | -0.755 | -0.265 | -0.400 | -0.118 |
| -N-P | 0.000 | -0.340 | -0.550 | -0.190 | 0.046 | -0.083 | -0.358 | -0.524 | -0.062 |
|
-N+P: Nitrogen starved in the presence of P-factor -N-P: Nitrogen starved in the absence of P-factor |