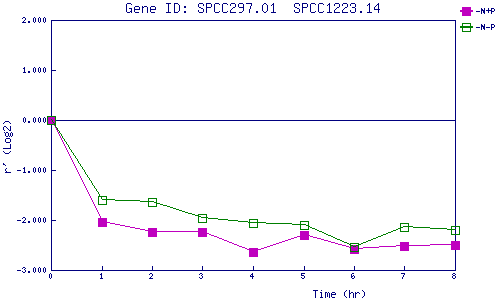
| 0 | 1 | 2 | 3 | 4 | 5 | 6 | 7 | 8 | |
| -N+P | 0.000 | -2.037 | -2.242 | -2.237 | -2.647 | -2.306 | -2.588 | -2.518 | -2.507 |
| -N-P | 0.000 | -1.607 | -1.630 | -1.960 | -2.058 | -2.096 | -2.535 | -2.147 | -2.210 |
|
-N+P: Nitrogen starved in the presence of P-factor -N-P: Nitrogen starved in the absence of P-factor |