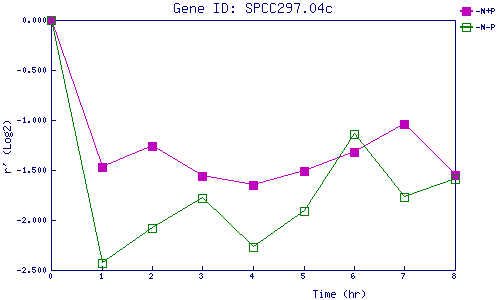
| 0 | 1 | 2 | 3 | 4 | 5 | 6 | 7 | 8 | |
| -N+P | 0.000 | -1.474 | -1.255 | -1.559 | -1.646 | -1.507 | -1.321 | -1.039 | -1.549 |
| -N-P | 0.000 | -2.429 | -2.081 | -1.781 | -2.267 | -1.909 | -1.138 | -1.772 | -1.588 |
|
-N+P: Nitrogen starved in the presence of P-factor -N-P: Nitrogen starved in the absence of P-factor |
