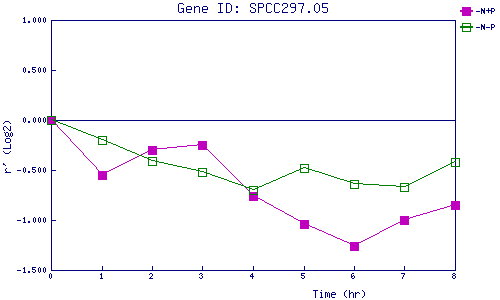
| 0 | 1 | 2 | 3 | 4 | 5 | 6 | 7 | 8 | |
| -N+P | 0.000 | -0.547 | -0.297 | -0.247 | -0.755 | -1.035 | -1.263 | -0.995 | -0.850 |
| -N-P | 0.000 | -0.199 | -0.408 | -0.515 | -0.696 | -0.475 | -0.638 | -0.668 | -0.416 |
|
-N+P: Nitrogen starved in the presence of P-factor -N-P: Nitrogen starved in the absence of P-factor |