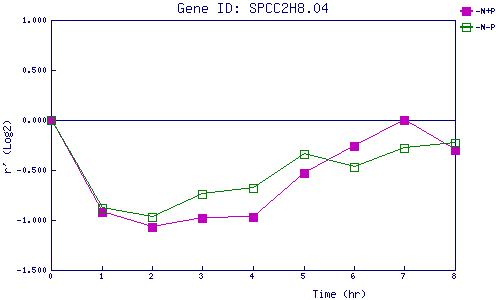
| 0 | 1 | 2 | 3 | 4 | 5 | 6 | 7 | 8 | |
| -N+P | 0.000 | -0.921 | -1.074 | -0.975 | -0.969 | -0.527 | -0.262 | -0.004 | -0.297 |
| -N-P | 0.000 | -0.885 | -0.970 | -0.740 | -0.676 | -0.335 | -0.470 | -0.278 | -0.232 |
|
-N+P: Nitrogen starved in the presence of P-factor -N-P: Nitrogen starved in the absence of P-factor |