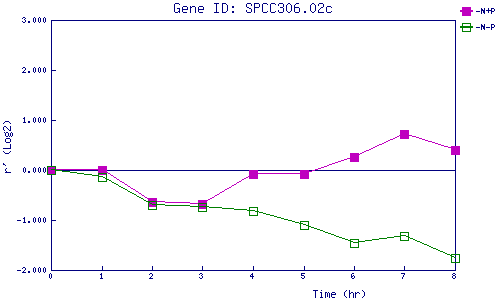
| 0 | 1 | 2 | 3 | 4 | 5 | 6 | 7 | 8 | |
| -N+P | 0.000 | -0.004 | -0.632 | -0.679 | -0.080 | -0.083 | 0.268 | 0.722 | 0.409 |
| -N-P | 0.000 | -0.138 | -0.702 | -0.733 | -0.829 | -1.091 | -1.462 | -1.315 | -1.760 |
|
-N+P: Nitrogen starved in the presence of P-factor -N-P: Nitrogen starved in the absence of P-factor |