set1
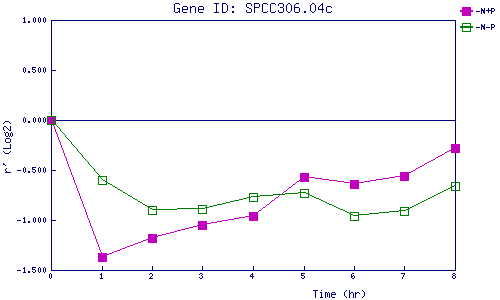
| 0 | 1 | 2 | 3 | 4 | 5 | 6 | 7 | 8 | |
| -N+P | 0.000 | -1.367 | -1.175 | -1.046 | -0.961 | -0.567 | -0.642 | -0.565 | -0.275 |
| -N-P | 0.000 | -0.599 | -0.901 | -0.892 | -0.772 | -0.734 | -0.963 | -0.909 | -0.657 |
|
-N+P: Nitrogen starved in the presence of P-factor -N-P: Nitrogen starved in the absence of P-factor |