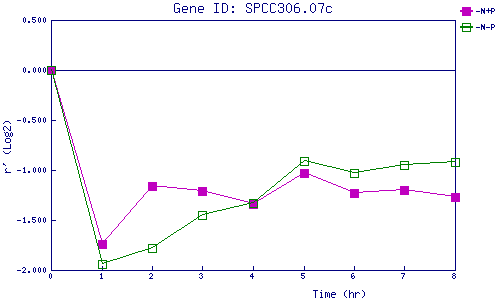
| 0 | 1 | 2 | 3 | 4 | 5 | 6 | 7 | 8 | |
| -N+P | 0.000 | -1.743 | -1.164 | -1.208 | -1.336 | -1.029 | -1.230 | -1.202 | -1.268 |
| -N-P | 0.000 | -1.942 | -1.784 | -1.447 | -1.327 | -0.908 | -1.030 | -0.950 | -0.922 |
|
-N+P: Nitrogen starved in the presence of P-factor -N-P: Nitrogen starved in the absence of P-factor |