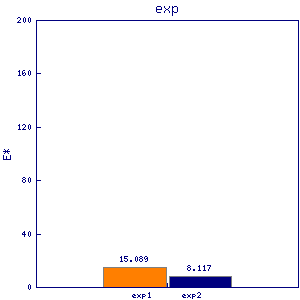
cap cap1 wtf8
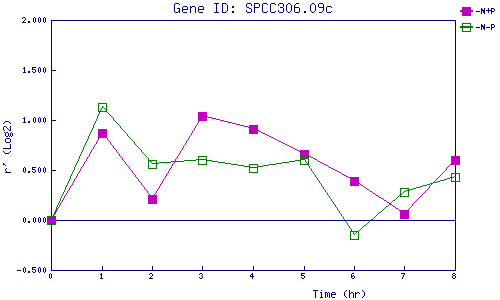
| 0 | 1 | 2 | 3 | 4 | 5 | 6 | 7 | 8 | |
| -N+P | 0.000 | 0.869 | 0.214 | 1.042 | 0.909 | 0.657 | 0.391 | 0.061 | 0.603 |
| -N-P | 0.000 | 1.126 | 0.557 | 0.605 | 0.519 | 0.603 | -0.147 | 0.282 | 0.434 |
|
-N+P: Nitrogen starved in the presence of P-factor -N-P: Nitrogen starved in the absence of P-factor |